What if you could get a daily pulse on how your customers feel and how that changes over time? What if you could watch how mobile customer sentiment changes in real-time following version releases, feature releases, and more?
Brands that measure customer sentiment on a yearly, quarterly, or even monthly basis experience a disconnect between their actions and the consequences of how their actions make their customers feel. Daily measurement of customer sentiment provides a precise look at the cause and effect of changes you’re making. Infrequent customer sentiment measurement prohibits brands from taking action to positively impact customer sentiment. If customer sentiment shifted downwards month-over-month, can you identify exactly what caused the decrease?
In today’s post, we look at data from our recently released Mobile Customer Engagement Benchmark Report to help understand why daily mobile customer sentiment measurement is crucial to success, supported by industry standards based on data gathered from thousands of apps across all app store categories.
For access to the full report, download here.

There are three methods for taking a daily pulse on mobile customer sentiment that we focus on in this assessment: Love Dialog, Net Promoter Score (NPS), and Ratings and Reviews. Let’s take a look at the first method.
Data note: The data in this report are from thousands of unique Android and iOS apps across all app categories from January 2017 to December 2017. The data was captured by interactions deployed using Alchemer Mobile (formerly Apptentive)’s mobile communication suite, which has powered conversations with nearly a half a billion customers of Fortune 500 brands across 1.9 billion devices worldwide.
Method #1: Love Dialog
Would your customer service team treat an angry customer the same as they would treat an elated customer? Probably not. Would you communicate with customers without first knowing how they feel about you? You could, but you probably won’t get your message across very effectively. Understanding how your customers feel is the catalyst for all other communication. Treat digital interactions as you would in-person interactions—with context in mind.
We developed a simple, yet effective yes or no question called the Love Dialog to give brands the context they need to interact with customers in the most relevant way. The Love Dialog gives brands an honest look at customer sentiment and how it changes over time.
The graphic below provides a visualization of how the Love Dialog works.
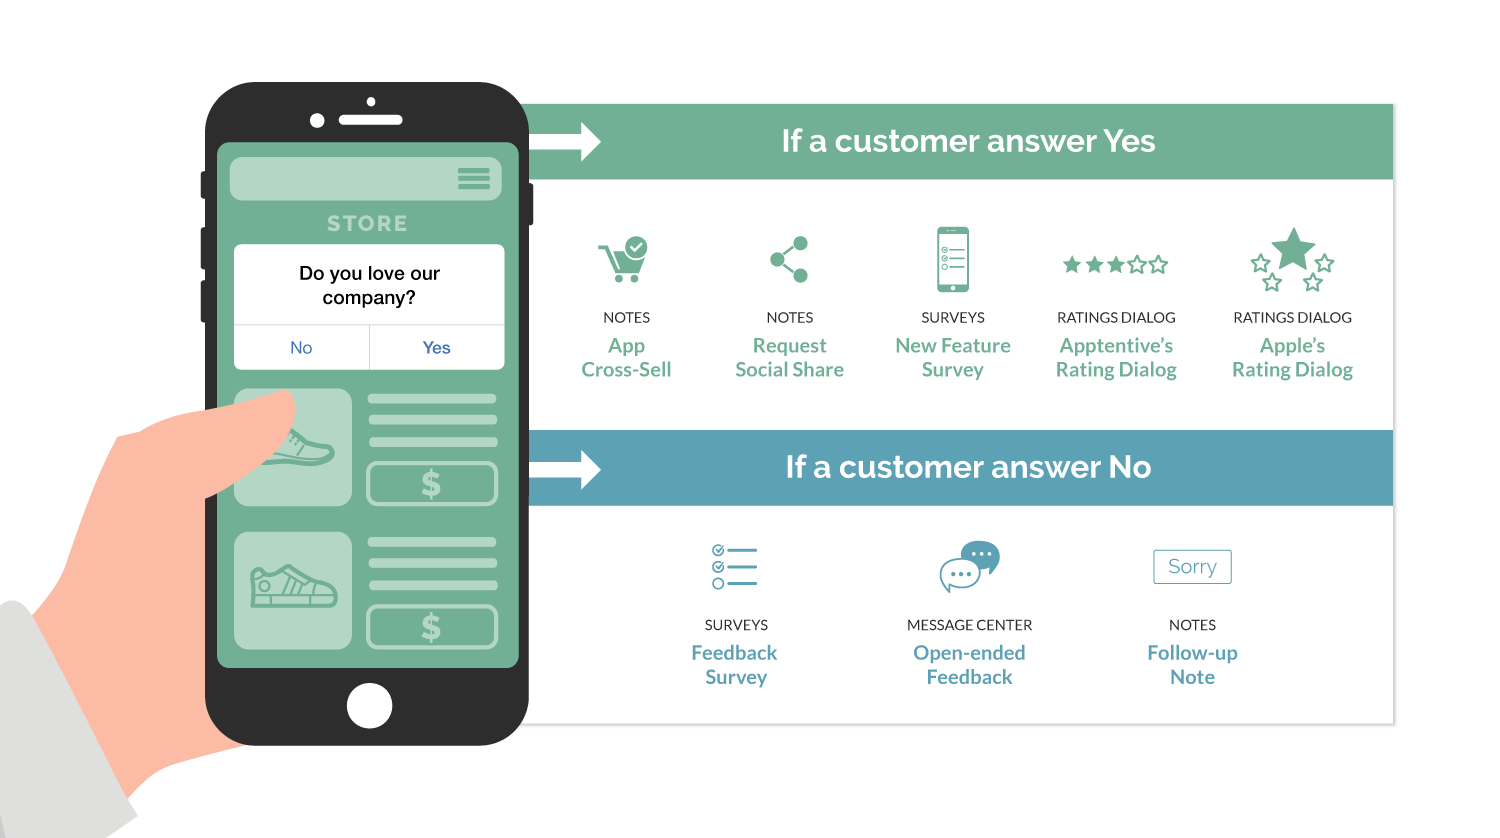
The Love Dialog boasts an extremely high response rate, due to its simplicity. Consumers are more willing to respond when questions are straightforward, and can be answered in no time.
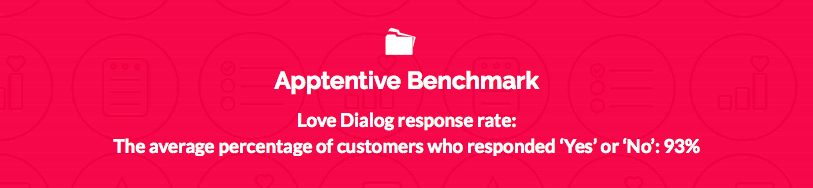
Our customers use the Love Dialog to measure customer sentiment daily and understand how changes in the experience directly impact customer sentiment. For our benchmark, the average percentage of customers who respond ‘Yes’ or ‘No’ to the Love Dialog is 93%.
When measured on a daily basis, on a large scale, brands are able to measure a “Love Ratio” that gives them an active and accurate pulse of customer happiness. This metric is highly consistent year after year across our entire audience. Below are the benchmarks for the Love Ratio.
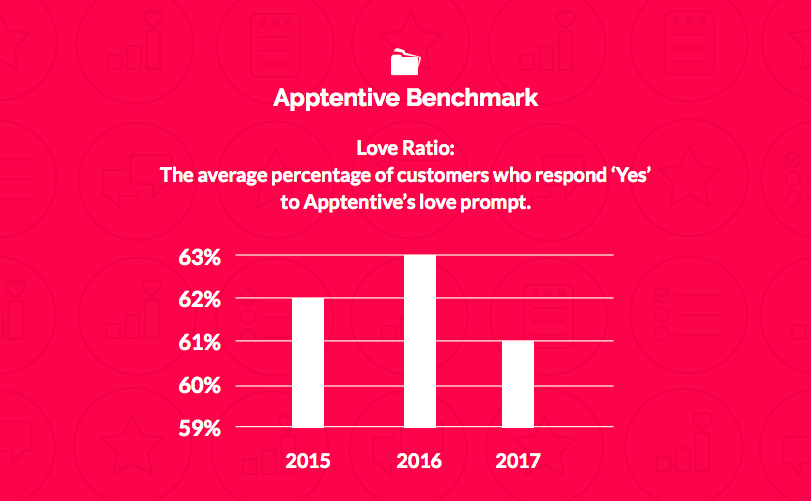
The average percentage of customers who respond ‘Yes’ to Alchemer Mobile (formerly Apptentive)’s Love Prompt is 61%. For comparison, the average in 2016 was 63%. The average for Android is 60% and 61% for iOS.
The slight decrease from 2016 to 2017 could be related to the increase in the number of customers companies are interacting with. Companies are asking more of their customers how they feel, which means they’re getting a more accurate, holistic look.
The deeper question: who changed their answer and why?
An important piece of tracking customer sentiment is understanding how sentiment changes over time. 9% of people who responded to the Love Dialog changed their answers over the course of 2017. Of those 9% of people, 48% were won over, meaning they changed from ‘No’ to ‘Yes.’ 51% of those people were lost, meaning they changed their answer from ‘Yes’ to ‘No.’
It’s important that companies define the traits and experiences of their fans and opportunities. For those that become opportunities, can you identify the underlying issue and fix it? For new fans, can you pinpoint what changed their experience from a negative to a positive and replicate it with other opportunities?
If a customer changed their answer to the Love Dialog, identifying what caused that switch is key. Understanding how your customers feel and how their feelings change over time gives you the opportunity to respond in a personal way that’s most relevant to how the individual customers feel in a particular moment in time.
Method #2: Net Promoter Score (NPS)
Net Promoter Scores (NPS) are used as another way to track customer sentiment. NPS is considered a leading growth indicator across industries. It’s a measure of customer loyalty and sentiment that can be benchmarked against competitors.
As a refresher, respondents to an NPS question are grouped into three categories based on their ratings:
- Promoters (score 9-10): Loyal customers who will keep purchasing and will refer the business to others
- Passives (score 7-8): Satisfied customers, but may be swayed by competitive offerings
- Detractors (score 0-6): Unhappy customers who can damage your brand by negative word-of-mouth
Alchemer Mobile (formerly Apptentive) has specific NPS surveys that our customers use to supplement the Love Dialog to check the pulse of their customer sentiment on specific features or aspects of their business. For example, a brand can use an Alchemer Mobile (formerly Apptentive) NPS survey to ask customers how they feel about a new VR shopping experience feature. The Alchemer Mobile (formerly Apptentive) benchmark for NPS score per survey is +23.

To get more out of NPS, we recommend companies add an open-ended feedback box that allows consumers to explain why they chose the score they gave.
Gathering open-ended feedback with NPS empowers brands to derive context out of their quantitative NPS score to better understand where they’re succeeding and how they can improve. For more tips on how to use NPS, check out our blog Why Net Promoter Score Isn’t Enough: Tips for Leveraging NPS+. If you’re curious how to calculate NPS, read our blog post How to Calculate NPS.
Method #3: Ratings and Reviews
People make snap judgements about people in seconds, and they make snap judgements about apps just as quickly. Ratings and reviews are your apps’ social proof, telling all potential customers whether or not your app is worth the memory on their phone. They influence conversion and customers’ perception of your brand as a whole.
In a recent consumer survey we conducted, 55% of respondents said a 1-star or 2-star app store rating of a well known brand’s app negatively impacts their view of the brand as a whole. So while it may be a vanity metric, ratings and reviews do have real consequences on conversion rates and brand reputation.
Below are the Alchemer Mobile (formerly Apptentive) benchmarks for average volume of ratings and reviews.
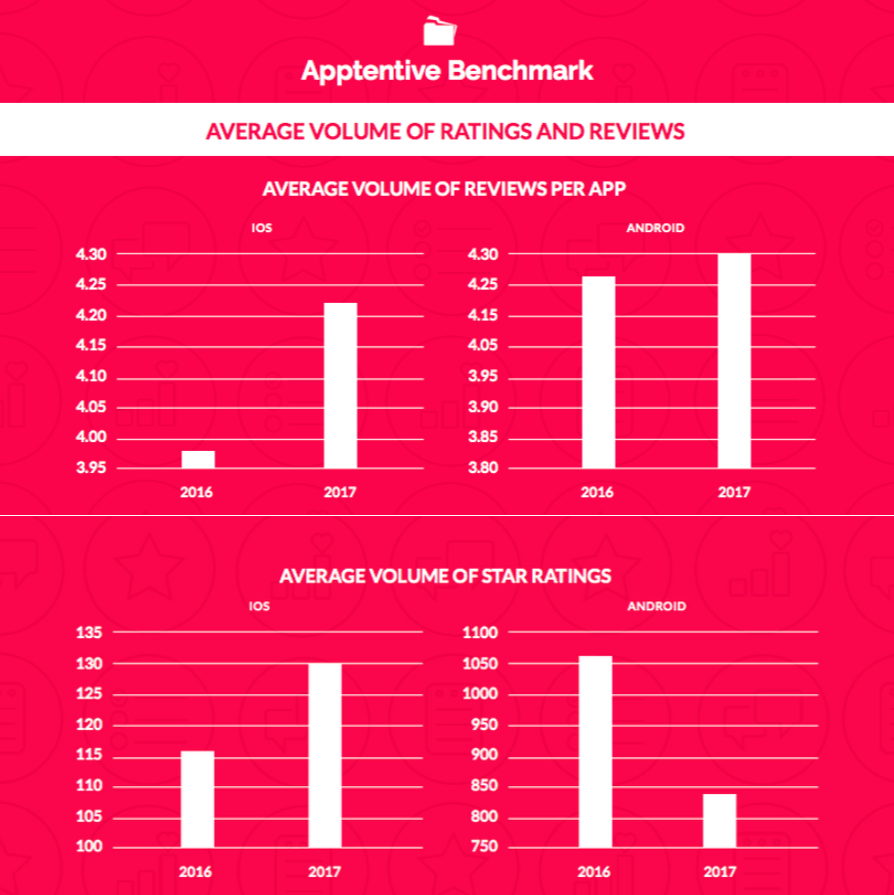
And here are our benchmarks for distribution of star ratings.
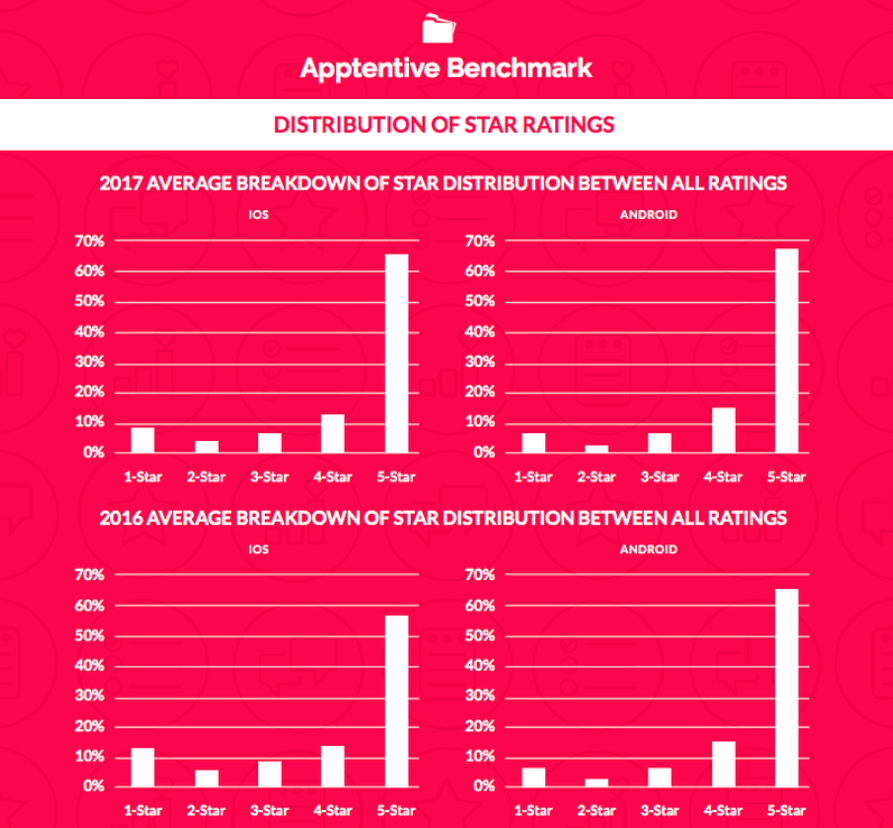
Star ratings and the volume of reviews are up for iOS apps. This is probably caused by Apple’s new rating prompt, which makes it easy for customers to leave ratings and reviews without leaving the app. Since the launch of iOS 11, the median number of app ratings has gone up by 88% and the median number of reviews has gone up by 19% for Alchemer Mobile (formerly Apptentive) customers.
While reviews were slightly up for Android, star ratings are down by a significant amount. Google cleaned up the Play Store in 2017, removing 700,00 apps—a 70% increase as compared to how many apps Google removed in 2016.
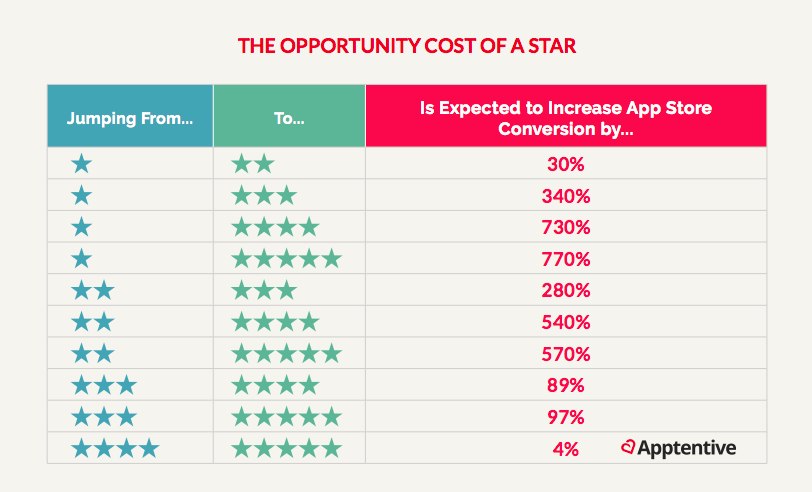
The opportunity cost of a star is huge. How huge? Moving a three-star app to four-stars, for example, can lead to an 89% increase in conversion. For a look at the full opportunity cost analysis, consider the chart below.
Data gives companies more context into how their customer experience is being received, and can help identify gaps that need to be addressed. The ability to analyze customer feedback on a large scale is a challenge many companies face, hindering their ability to incorporate explicit customer data into their decision making process. Most companies crowdsource anecdotal customer feedback from customer success, product, and sales teams without any real strategy behind who owns the process. But executives realize that this data is a missing link in building a better customer experience. A January 2018 survey of senior decision-makers by Verndale found that big data and analytics is the top priority for companies investing in technology to improve their customer experience.
Understanding the broad implications and main learnings from thousands of reviews, survey responses, and messages can be a daunting task. That’s why we developed Insights, AI-powered analytics that makes understanding explicit customer feedback simple and quick. Insights digs into the raw text found in app store reviews, Alchemer Mobile (formerly Apptentive) survey responses, and Alchemer Mobile (formerly Apptentive) messages. In doing so, Alchemer Mobile (formerly Apptentive) can now tell you how customers are feeling and give you a very powerful set of analysis about why they feel that way.
Takeaways
Listening to customers’ daily feedback is a crucial part of success in today’s quick-changing landscape. Feedback helps you understand your customers, which is the first step in becoming a customer-centric company. Without understanding who your customers are, how they feel, and what they want, you will have a difficult time communicating with customers and gathering the information you need to build a customer experience they’ll love.
For more on mobile customer sentiment benchmarks for 2018, grab your free copy of our full report below.
This benchmark data exists so brands can understand how effectively they’re measuring their customer experience, communicating with their customers, and earning customer love. If you feel like you may be missing the (bench)mark, we can help! Leave your thoughts in the comments below to start a discussion, or reach out directly to an Alchemer Mobile (formerly Apptentive) team member.
