Data shows that customers expect to be interacted with, and those interactions heavily influence retention. 51% of consumers expect companies to ask them for feedback directly, which may explain why the volume of feedback is low for companies who don’t bother asking. Unprompted, companies typically only hear from ~1% of their customers. Not only do customers expect it, it’s also a strategic investment—we’ve found that simply interacting with customers and gathering mobile customer feedback can increase three-month retention by as much as 400%.
Companies can’t call themselves customer-centric if they aren’t talking with and listening to their customers, no matter the channel or vehicle. That said, blasting customers or soliciting feedback from mass groups of customers is not the type of strategy that will yield quality results.
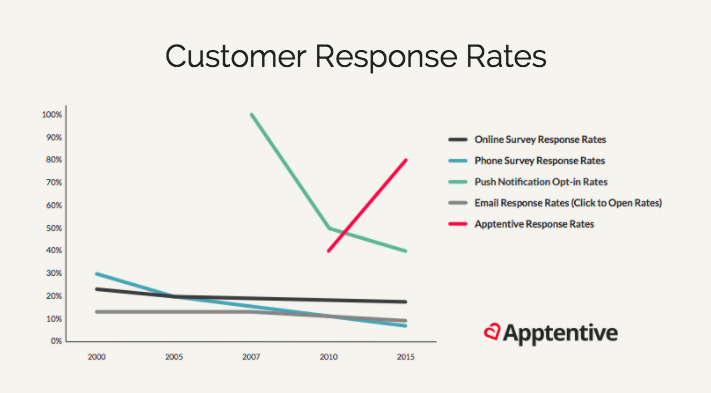
While efficacy on all other channels is decreasing, efficacy on mobile is steadily increasing. Consumers are open to talking to brands on mobile. Capitalizing on mobile’s unique position to drive maximum engagement is paramount to brands who are interested in learning all they can about their customers. Below, the interaction and response rate, survey, and messaging benchmark data show the power of proactively talking to more customers.
In today’s post, we look at data from our recently released Mobile Customer Engagement Benchmark Report to help understand how initiating proactive conversations with mobile customers helps brands gather more mobile customer feedback and, in turn, increase their revenue. Use the benchmarks below to identify where you have opportunity to fine-tune your communication strategy.
1. Interaction and response rates
Annoying customers is not productive. Engaging customers at the right time and place in the experience with a contextually appropriate message will lead to higher engagement rates and higher quality interactions. Keeping track of how many customers you’re interacting with and their receptivity to those interactions is key to understanding the health of your communication strategy. Use our interaction and response rate benchmark data to gauge the health of your communication strategy.
The average percentage of mobile customers brands reach out to is captured in the interaction rate. Surveys, Dialogs, Notes, and Messages are included in this metric.
The average percentage of mobile customers who respond to interactions are captured in the response rate. Surveys, Dialogs, Notes, and Messages are included in this metric.
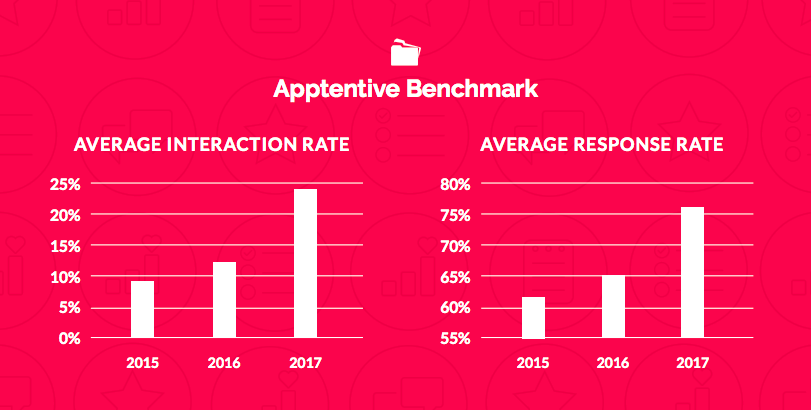
The average interaction rate is 24%, meaning that on average, brands using Alchemer Mobile (formerly Apptentive) interact with 24% of their mobile app customers over the course of a year. The average interaction rate is 24% on Android, and 24% on iOS. For reference, last year’s interaction benchmark was 12%. That’s a 100% increase year-over-year.
The average response rate to interactions is 76%. This means that of the 24% of customers who brands interact with, an average of 76% of customers respond to the interactions.
The average response rate on Android is 66% and 84% on iOS. For reference, last year’s response rate benchmark was 65%. That’s a 17% increase year-over-year.
The increase in response rate shows that brands are paying attention to context. Following the best practice of interacting with customers at the right time, right place, and with the right message pays off. If your interaction rate goes up while your response rate goes down, this is a sign you’re annoying your customers. Use this as an opportunity to assess your strategy: eliminate unnecessary interactions, tighten up your targeting, reevaluate your trigger points, and reconsider your message.
2. Mobile surveys
Brands use surveys to proactively dig in further. Whether it’s to understand why customers don’t love their experience, conduct customer focus groups, or to gauge how customers feel about a brand new feature, surveys are useful for myriad purposes.
The key to surveys is a healthy response rate. Without that, the data is difficult to trust and it wastes an opportunity for a meaningful interaction. Again, our right time, right place, right person, and right message methodology is designed to yield a high response rate to surveys.
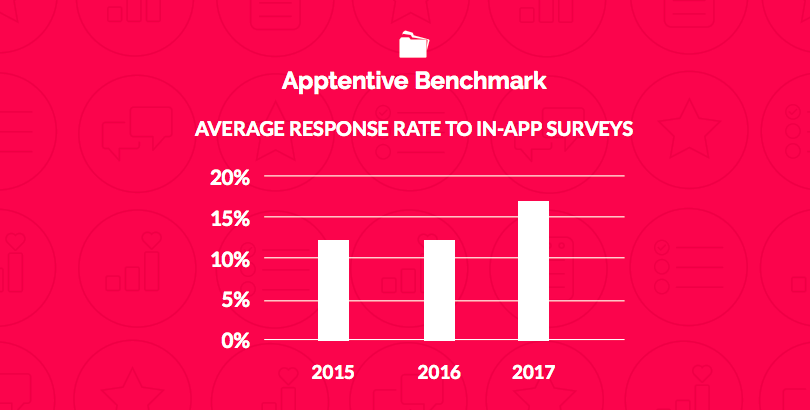
The average response rate to in-app surveys is 17%; 14% on Android and 19% on iOS. For reference, the average response rate in 2016 and 2015 was 13%. That’s a 31% increase year-over-year.
A response rate of 17% is significantly higher than the 1-3% response rate companies typically see. Some of our customers have even been able to achieve survey response rates of 60%.
Pro-tip: To increase your survey response rate, know your audience and the goal of the survey, keep the survey short (1-5 questions), and optimize it for mobile. Check out our blog post to learn more about how to optimize surveys for mobile: 9 Tips for Writing Mobile Optimized Survey Questions.
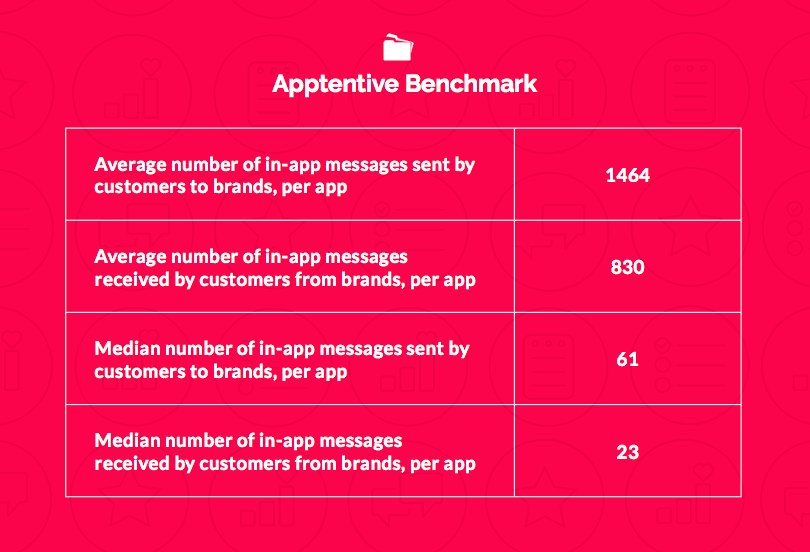
3. In-app messages
Consumers have made it clear that chat bots are not the way they prefer to talk to brands. In a study by PwC, more than eight in 10 people said they prefer to interact with a human. That sentiment isn’t on track to change even as technology advances, either. 55% of survey respondents strongly disagreed with the statement that as technology improves, we won’t need humans for a great customer experience.
It shouldn’t come as a surprise that people prefer to talk to real people instead of bots. Including two-way messaging in your app so that customers can easily reach out to you whenever they need to without having to leave the app to go to your website, call you, or send you an email is important. It prevents a lot of frustration and increases the likelihood that customers will actually reach out to you. The more hoops you make customers jump through to talk to you increases the likelihood that they’ll abandon your app without telling you why, leading to customer experience issues that you won’t even know to look for.
Takeaways
The year-over-year increase in interaction and response rates, response rates to surveys, and more signals there has been a significant shift in the value of customer-centric strategies. Being customer-centric is no longer aspirational. Rather, it’s a priority that brands are putting into action as the increase in mobile customer feedback helps drive product roadmaps, prioritizing company updates, and ultimately, increasing revenue.
The increase in the percentage of customers interacted with shows that brands are putting more effort into communicating with their customers. And the increase in the percentage of customers responding shows customers are welcoming the communication. Not only has there been an increase in the number of customers companies are interacting with, there has also been an increase in the diversity of those audiences.
If you want to learn more about how to leverage mobile customer feedback to drive revenue, and to see if your current strategy hits the (bench)mark, download a free copy of our full research report here.
