Today, we’re thrilled to release the 2020 edition of our annual Mobile App Engagement Benchmark Report!
This is our fifth consecutive year conducting this research. Data from our 2016, 2017, 2018, and 2019 reports is included to show shifts in brand focus and engagement over time.
Why is this report important for app publishers?
Consumer expectation and emotion shifts constantly. In order to rise to the challenge, app publishers must understand their app’s performance when compared others, both in its app store category and beyond. The data in this report is displayed as granular as possible in order for app publishers to see the forest for the trees.
According to Gartner (ID G00711516, November 2019), mobile marketing, product, and customer experience leaders must measure emotion in addition to more conventional customer experience and engagement metrics to not only understand how a customer feels about an experience, but also why they feel that way. In order to measure emotion, app publishers must have a baseline understanding of how their current performance stacks up with the marketplace.
What’s included?
Inside the report, you’ll find important mobile app benchmarks, including:
- Alchemer Mobile (formerly Apptentive) customers see 90-day consumer retention rates (49%) that are 63% higher than the industry average for mobile app retention, which is 20-30%.
- The year-over-year volume of star ratings grew for both iOS (+158% from 2018 to 2019) and for Android apps (+44% from 2018 to 2019).
- There was a 29% increase in surveys sent in 2019 from 2018. Even with the year-over-year increase in the number of surveys sent, the survey response rate held steady at 18%. For reference, the market cross-industry average response rate is 1%.
- The 2019 average response rate for an Alchemer Mobile (formerly Apptentive) Note-linked survey was 54% (iOS 50%, 62%). Again, the market cross-industry average for in-app survey response rates is 1%.
- Across all categories, brands’ average expressed sentiment for “Fans” was 60% (iOS 58%, Android 65%). The average number of “Risks” was 31% (iOS 32%, Android 28%).
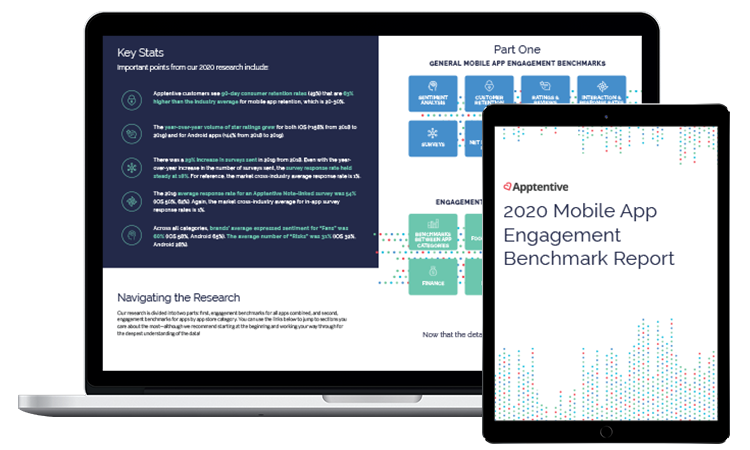
Our research is divided into two parts: first, engagement benchmarks for all apps combined, and second, engagement benchmarks for apps by app store category. You can use the links below to jump to sections you care about the most—although we recommend starting at the beginning and working your way through for the deepest understanding of the data!
Grab your copy now
Grab your free copy of our 2020 report now to see where your app’s performance exceeds or falls short of market expectations.

While there’s still more to do, 2019 is the most we’ve seen brands leverage mobile customer feedback to improve their products and adjust their overall business goals. We look forward to helping you do more to put your customers at the center of your business in 2020 and beyond!
